El día despues del Data Day
Tuvieron que pasar 3 meses para que me dignara en darle seguimiento a mi último post Nos vemos en el Data Day!. Esto solo pudo resultar en dos cosas:
- Nos vimos en el Data Day.
- NO nos vimos en el Data Day.
Para todos aquellos que entran dentro de (1) fue todo un verdadero gustazo! Ahora bien, si eres parte de (2) no te preocupes, a continuación va una recapitulación de lo que sucedió.
Nos vemos en el DataDay!
Ya todo está listo para el DataDaySG este 15 de Marzo en #CDMX en donde voy a estar presentando: El Inventario Fantasma: El “Hello World” de Retail Analytics… a ver que tal…
Ahí nos vemos!
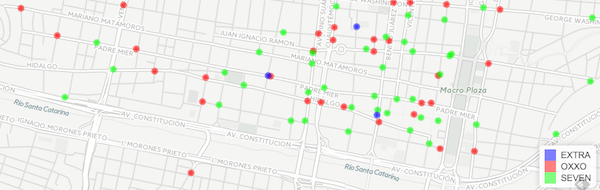
A Mexican Convenience Store Mexican Standoff
There are two major competitors in the Convenience Store industry in Monterrey, Mexico: “OXXO”” and “7 Eleven”. People usually don’t realize how big is the footprint they have in the metropolitan area. Taking advantage of inegiRand leafletR packages I decided to do a quick visual exercise to learn who is where
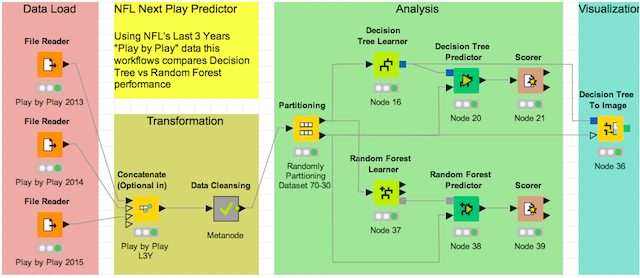
NFL next play prediction
My take on AI in American Football
After Money Ball, sport teams across the world want to gain advantages based on data. Even foosball tables store data now.
Earlier this week I ran across an article from Wired named Football Coaches Are Turning to AI for Help Calling Plays. Apparently this isn’t a new thing, so I decided to give it a try using KNIME. I must emphasize in “give it a try” since we only have 2 weeks left of NFL and then the fuss will be gone until next September.
If you are not familiar with KNIME I hope this works as an introduction to this multi-language platform. Otherwise, if you know your way around these type of nodes, then I look forward to discussing better ways to do this.
Visualizing Mexican Soccer Salaries with Plotly
Back in November I saw a post using ggplot2 to visualized MLS Player Salaries. I thought I would give it a try and replicate the analysis for the Mexican Soccer League using the newly open sourced Plotly but first I had to figure out where to get the data…

Hello World
###Welcome!
One of the motivations behind this blog is to keep up with all the things happening around R. On any given day there are too many new posts about R and what you can do with it. Using #rtodolist on my twitter helps me keep up with any post that I found interesting and reproducible. Once I’m in the mood, I’ll try to do a personal rendition to a #rtodolist post and add it to this blog.
Subscribe
Subscribe to this blog via RSS.
Categories
R 2
Plotly 1
Knime 1
Leaflet 1
Inegir 1
Retail 2
Español 2
Recent Posts
-
 Posted on 29 Jun 2016
-
Posted on 29 Jun 2016
-
 Posted on 31 Jan 2016
-
 Posted on 25 Jan 2016
Popular Tags
Rtodolist (3) R (2) Web scraping (1) Plotly (1) Knime (1) Machine learning (1) Random forest (1) Leaflet (1) Inegir (1) Retail (2) Español (2)