####Mapping Census Data in R #censuscourse
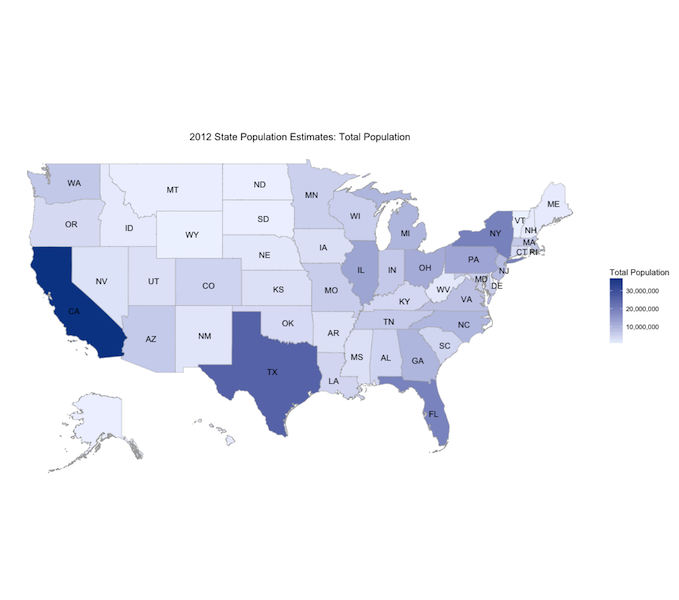
This is a simple shiny app that lets you select between different variables from the df_state_demographics data frame. You can also play with the argument num_colors from the state_choropleth formula to see how the color intensity changes
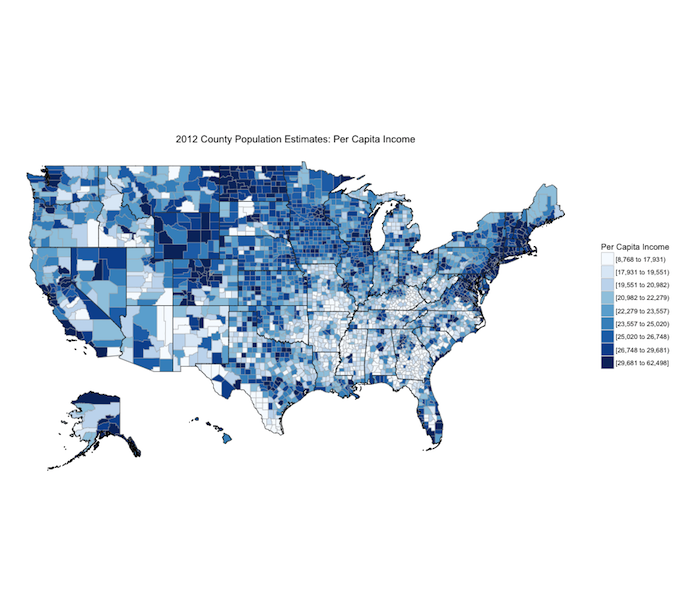
On the HW2 tab we need to create a choropleth of some other demographic statistic in the data.frame df_county_demographics.
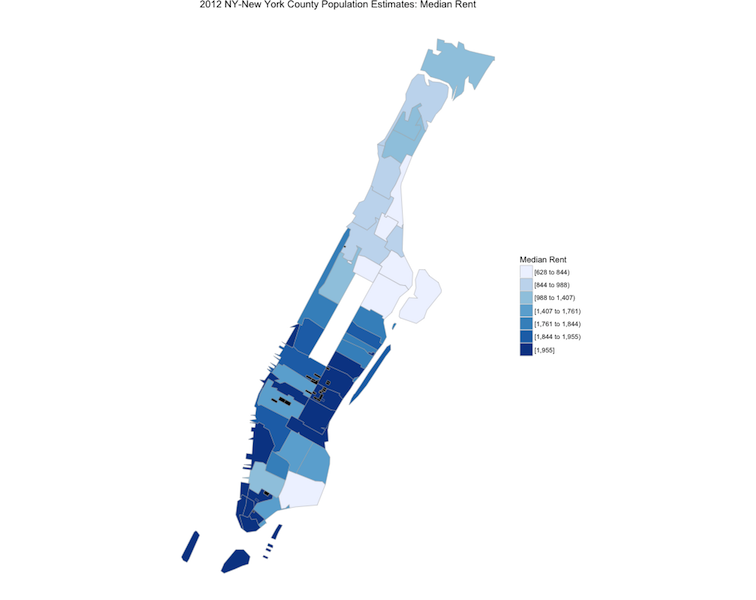
On the HW3 tab we create a choropleth - zoomed at the county level - for demographic statistic available in the data.frame df_zip_demographics. For this we'll use the formula zip_choropleth(). Also, Shiny gives us the advantage we can cross-reference the FIPS code list from https://www.census.gov/
Project Details
Date: Aug 22, 2015
Author: Arturo Cardenas
Categories: project
Tagged: r, choropleth, shiny apps
Client:


